A slow or unstable website can frustrate visitors before they even explore your content. We identify performance bottlenecks and optimize loading speed, responsiveness, and visual stability to create a smoother website experience.
Core Web Vitals measure three important aspects of real-world website experience: how quickly the main content loads, how quickly the page responds, and whether the layout stays visually stable.
Measures how long it takes for the largest visible content element, such as a main image or heading, to appear.
Measures how quickly a page responds visually after visitors interact through clicks, taps, or keyboard actions.
Measures unexpected movement of visible page elements while a visitor is viewing or interacting with the page.
Google evaluates these metrics using real-world user experience data, typically at the 75th percentile.
Website performance is about the complete experience, not simply how quickly a page opens. Visitors expect content to appear promptly, controls to respond without frustrating delays, and page elements to remain in place.
Explore a simplified visual example of how loading delays, delayed responses, and layout shifts can affect the experience of using a website.
Main content appears late, making the page feel slower to visitors.

Important content is available promptly, with a more consistent page experience.
This is a front-end illustration, not a real website speed test. Actual Core Web Vitals must be measured using suitable lab tools and real-user field data.
Several technical factors can affect Core Web Vitals. Identifying the actual cause is the first step toward making meaningful improvements.
Large image files and inefficient formats can delay the loading of important visual content.
CSS and JavaScript resources may delay the browser from rendering visible page content.
Heavy scripts and long main-thread tasks can slow down responses to visitor interactions.
Backend processing, hosting limitations, and caching problems can delay the start of page rendering.
Missing image dimensions, late-loading fonts, and dynamic content can cause elements to move.
External widgets, tracking scripts, and embedded tools can add extra loading and processing work.
We investigate the issues affecting your website, prioritize the most important fixes, and validate the changes after implementation.
Review performance data, page templates, loading behavior, and available diagnostic reports.
Find the resources, scripts, images, and layout elements contributing to poor performance.
Apply relevant optimizations to loading, responsiveness, image delivery, and layout stability.
Retest the affected pages and review available field data as it becomes available.
Our work focuses on the technical areas that influence page loading, interaction responsiveness, and visual stability.
Improve the delivery and rendering of the largest visible content element.
Reduce interaction delays caused by unnecessary JavaScript and long tasks.
Reduce unexpected layout shifts through stable dimensions and predictable rendering.
Review image dimensions, compression, formats, and loading priorities.
Identify unnecessary code and improve resource loading and execution.
Review caching configuration and server-side performance bottlenecks.
Improve font delivery and reduce unexpected text movement during loading.
Review critical resources and prevent unnecessary loading delays.
Evaluate external scripts and their impact on page responsiveness.
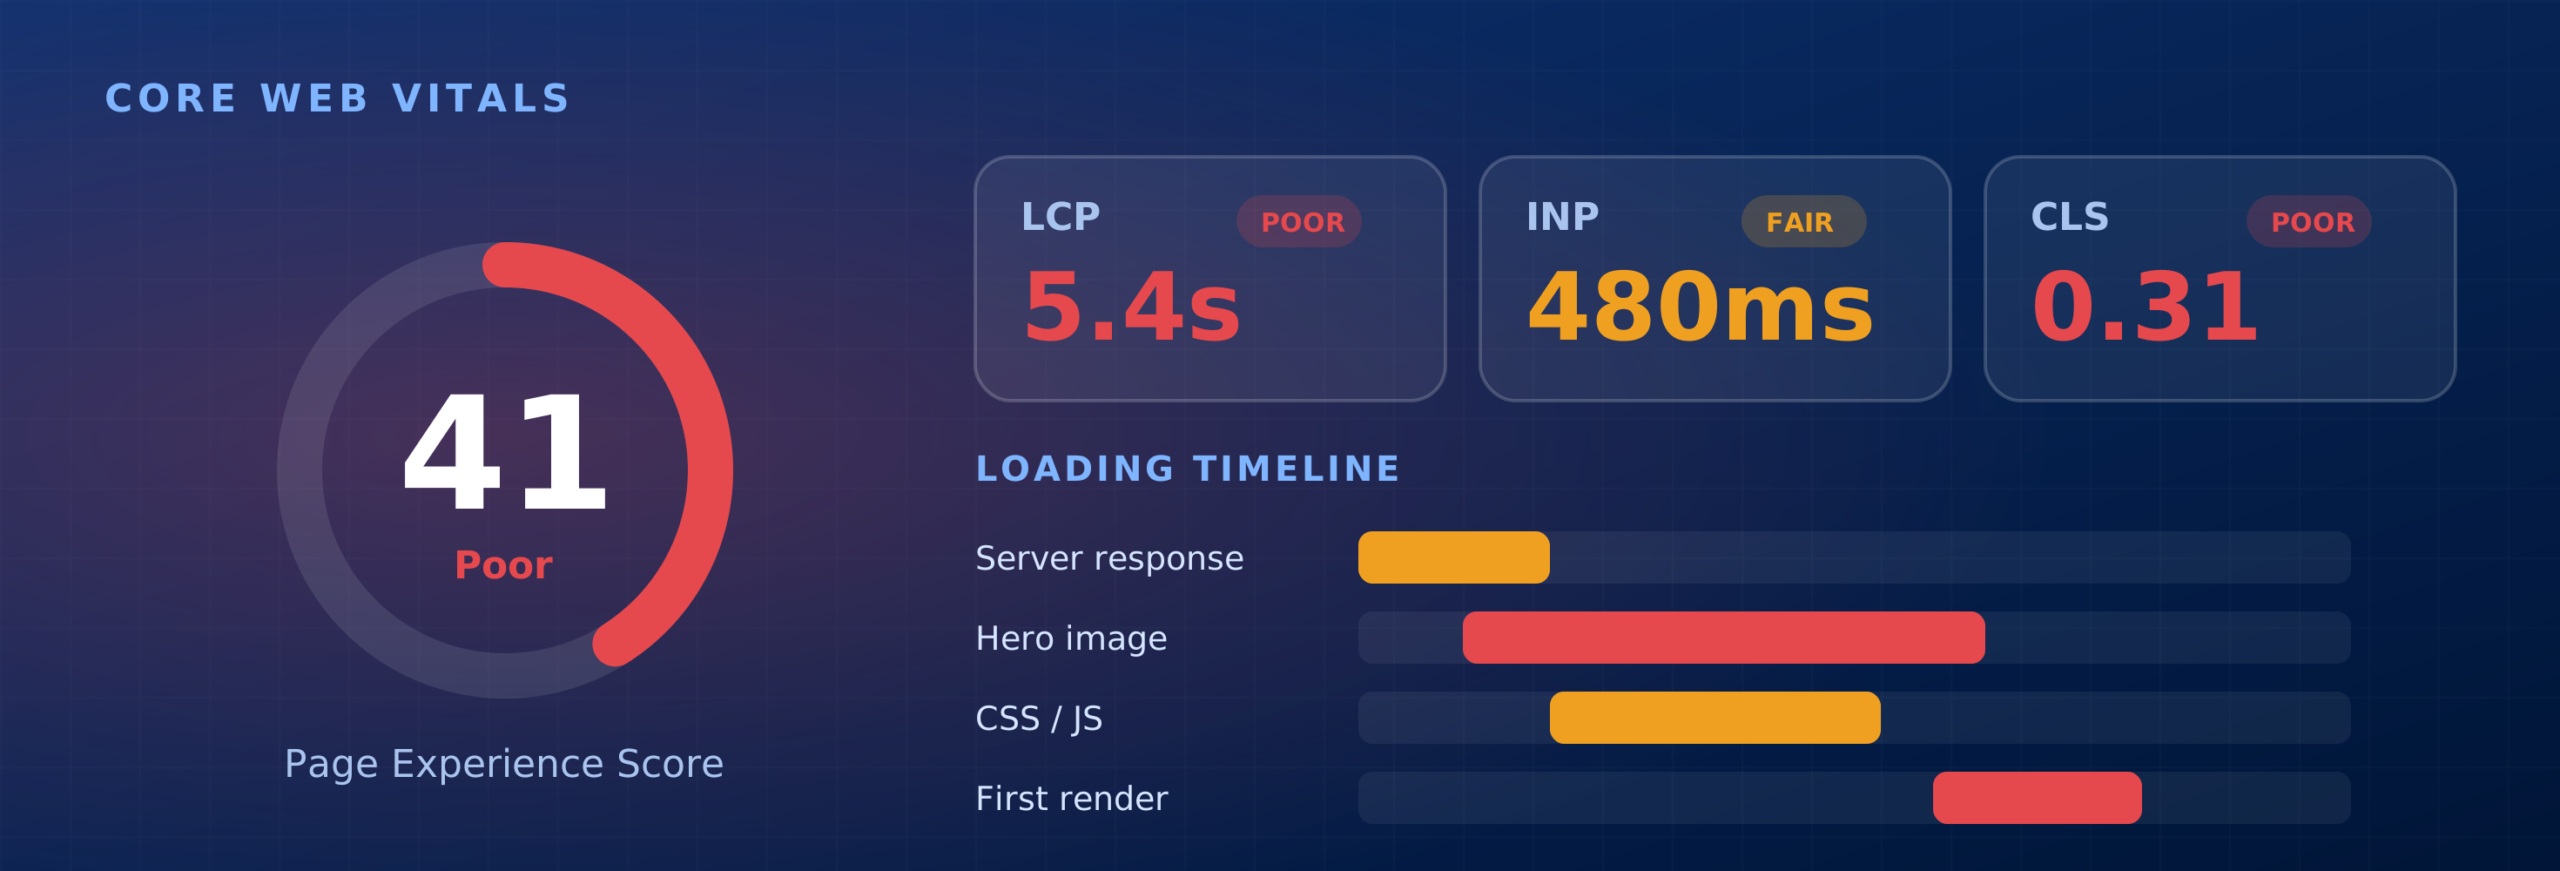
These illustrative values show how the three Core Web Vitals metrics are classified. They are not actual client results or a promise of specific improvements.
Answers to common questions about website performance, Core Web Vitals, and technical optimization.
Core Web Vitals are Google's user experience metrics that measure loading performance, responsiveness, and visual stability. Their three current metrics are LCP, INP, and CLS.
The three metrics are Largest Contentful Paint (LCP), Interaction to Next Paint (INP), and Cumulative Layout Shift (CLS). Each measures a different aspect of how visitors experience a website.
Google's good thresholds are LCP of 2.5 seconds or less, INP of 200 milliseconds or less, and CLS of 0.1 or less. These are assessed at the 75th percentile of page visits.
You can review real-user performance in Google Search Console's Core Web Vitals report and use PageSpeed Insights for page-level field data and Lighthouse lab diagnostics where available.
Common causes include slow server response, large images, render-blocking CSS or JavaScript, and delayed loading of the main visible content.
Start by investigating long JavaScript tasks, excessive event processing, and unnecessary main-thread work. Improving how interactions are handled can help the browser respond more promptly.
Unexpected layout movement can be caused by images without reserved dimensions, dynamically inserted content, late-loading fonts, advertisements, and other elements that change size or position.
Core Web Vitals are part of Google's page experience considerations and align with what its ranking systems seek to reward. Good scores alone do not guarantee higher rankings; relevant, useful content and other ranking factors remain important.
The timeline depends on the number and complexity of performance issues, website platform, hosting environment, and required development work. Some fixes are straightforward, while others need deeper technical changes and validation.
Yes. Search Forge Digital can review your website's performance, identify technical bottlenecks, prioritize relevant improvements, and help optimize loading performance, responsiveness, and visual stability.
Performance issues can affect how visitors experience your website. Let Search Forge Digital help identify technical bottlenecks and build a practical optimization plan around your website's needs.